This is “take 2” in writing this post so lets crack on (part 1 can be found here!) … In the below I’ll show you what I usually do every year but it doesnt cover ALL the functionality thats available. Maybe I’ll come back as and when I use the other stuff but for now this should give you a flavour of whats available.
There are in general three things I do:
- Look at the performance of our cohort across each paper compared to the Edexcel Average and put together something for the maths team.
- Use the student performance data that can be downloaded and import into a spreadsheet so that individual student performance can be looked at (especially at each grade boundary)
- Finally I look at where our 3, 4 and 5s have come from on each tier of entry to make sure that our tiering strategy is working. I will write this up another time as this blog post is going to be massive as it stands!
ACCESSING RESULTSPLUS
In order to access this service you need an EdexcelOnline account which needs to be set up by your exams officer and they need to give you the rights to access ResultsPlus.

Once set up you also need to (I think this is for all users now) need to have two factor authentication set, which for me, means I had to download an app on my phone called Pearson Authenticator and once logged in the app generates a code that I input:

Once in … you will see this option and like I’ve said above, we’re just going to look at the top option … ResultsPlus Analysis.

COHORT PERFORMANCE BY PAPER
I don’t usually try to access the service on results day because it takes too long, so I wait a few days. The area I’m interested in is the Cohort results section THEN the cohort paper analysis:

 From here you choose the relevant qualification and session which in this case was June 2024 and then “view paper analysis”:

This defaults to showing the performance of each question on Foundation paper 1 but you can change the paper by toggling the paper dropdown menu”. So I will print to PDF and then copy each papers output onto a PPT presentation.You can also export as an excel sheet but you don’t get such a pretty output! 
Once I’ve got this in my PPT I look at the papers and copy in the images of each question so that we can look as a team as to why certain questions were below the Edexcel Average. At this point I should point out you can also compare using the blue edit box next to the “edexcel average” for students achieving different grades. It all depends on context! If you are a school looking to make big improvements you look at the whole cohort picture but if you are maintaining your outcomes and looking for marginal gains I suppose you’d delve deeper into specific grades … I’ve never gone deeper due to my context! Yours will be different!
So for example this was the only question on F P2 that we didn’t exceed the Edexcel average. An easy fix I think … as we suspect some of our students just wouldn’t have brought in rulers and don’t like to ask for equipment so we’ll make sure that its on the desk this year. I know! I know! They should bring in equipment but who are we also penalising ? Especially when you delve deeper and see that a student who missed a grade 4 by 2 marks didn’t get this one correct … maybe they’d only have missed it by 1 mark? We’ll never know but we have to give them the best shot at achieving their best grade! Surely thats what we do!

I repeat this for all the questions that are “red” and then have a completed PPT to share with staff and have discussions about how to address it. Interestingly this year (today in fact!) I actually shared the relevant questions/papers with a couple of year 11 groups and they were adamant that they would have got the questions correct! We’re yet to go through it as a team but will do shortly.
From this you can also get access to a “highlight” report which can be useful. I know that some schools ask that HODs produce a report following an exam series and want them to include information about specific topics that need improving (or what went well too!) :


STUDENT PERFORMANCE DATA
I should say that I don’t spend hours doing a post mortem but it’s handy to look at the performance of some students and I know that teachers find it useful where they have students that haven’t got as high a grade as they were expecting to look at data at a student level. It’s also useful for resit students to have granular information about what they got wrong (and correct!) and for the Higher tier students going on to A level I’ve found that its useful for teachers to scan and see strengths and weaknesses (especially if you entry grade to A level is a grade 6 knowing what the students can and cannot do at the start of the A level course can be useful. So I download csv files that contain student by student detail at question level but it needs putting into a user friendly format which honestly does not take long.

I download the SIX csv files and save them somewhere obvious. 
The idea is to copy and paste this information into some spreadsheets that I’ve put together that will pull data for each student onto one page that shows their performance across the entire series of 3 papers. I will include 2 excel files at the end of this post which you may or may not find useful. I have changed the question descriptions on the spreadsheet to make them meaningful because thats the only criticism I have of the information from Pearson is that the question descriptions are the formal descriptions and not very student friendly. They are also very often quite generic as they’re from the specification.
These work by entering the student reference into cell E1 and it pulls the relevant data onto one sheet. 
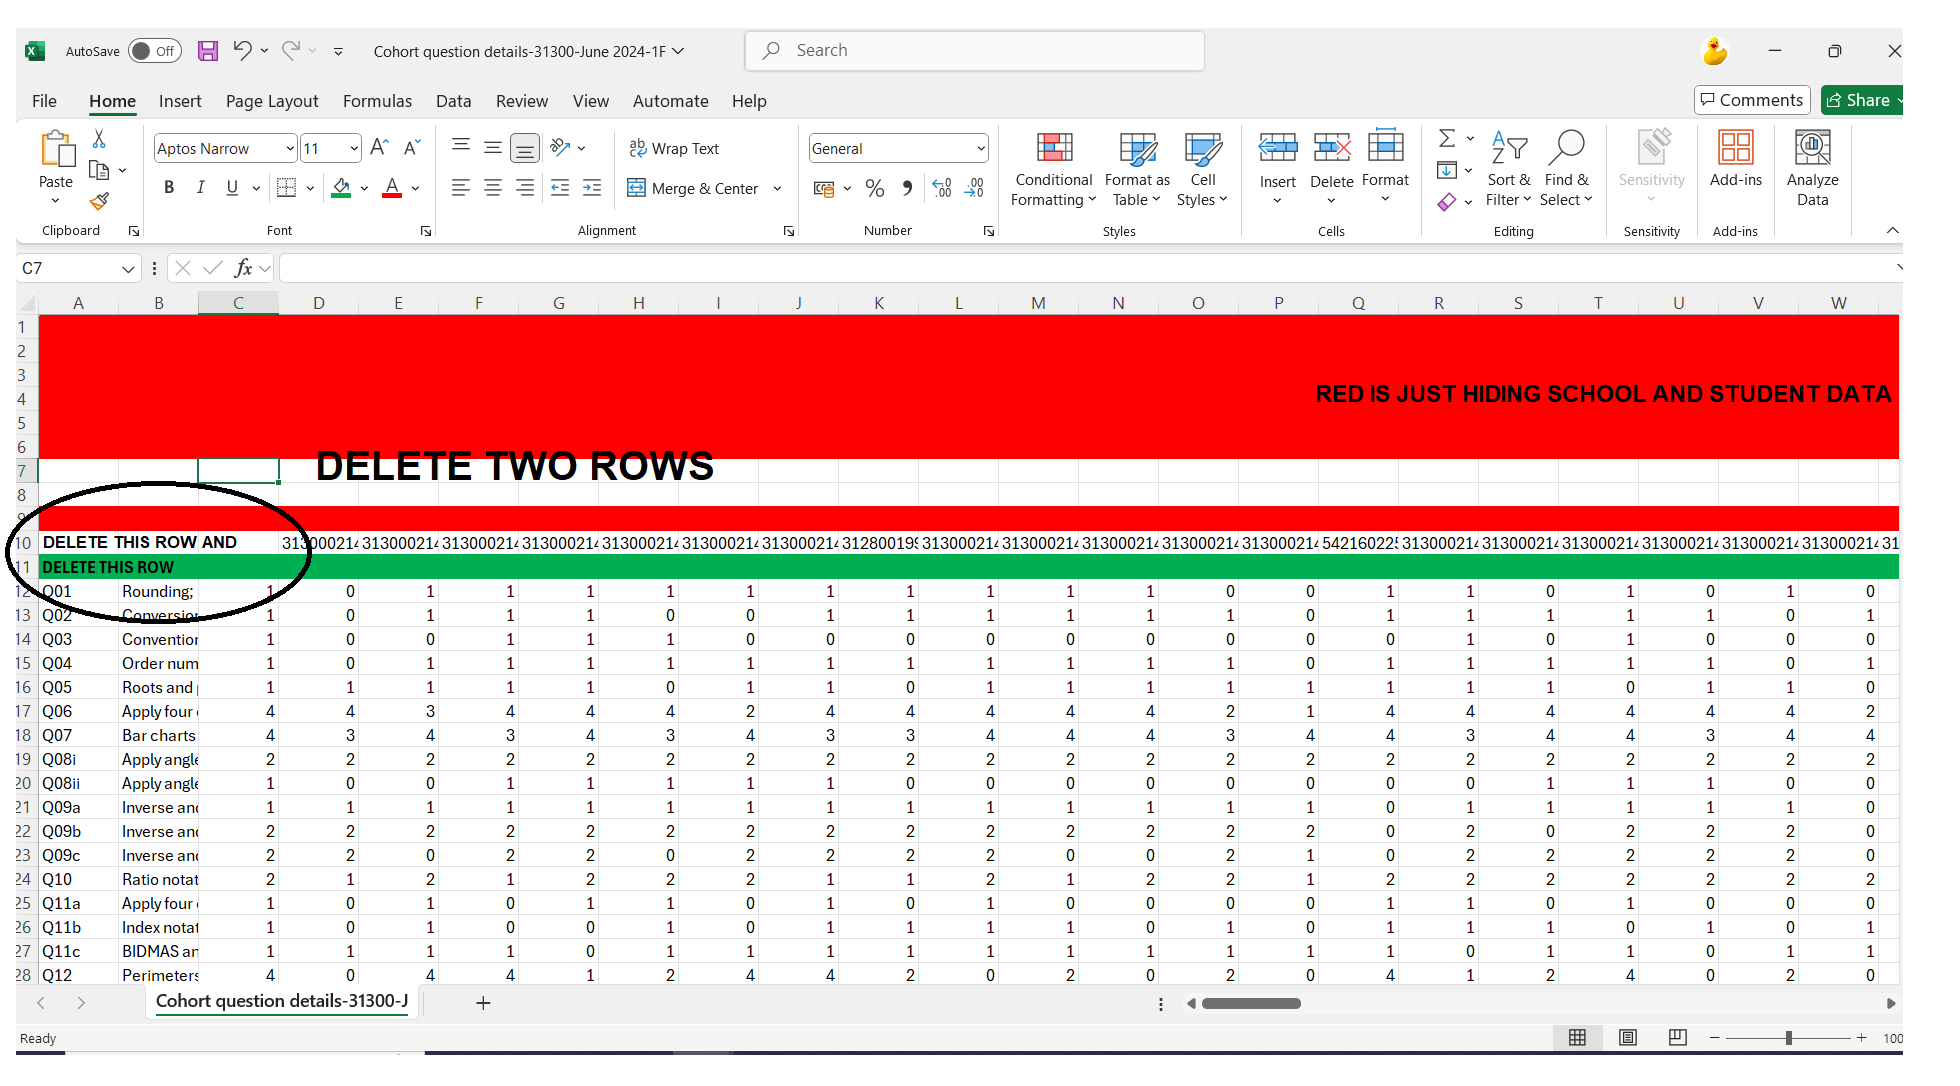
So, for each csv file BEFORE I copy the data into the relevant spreadsheet I have to delete some of the gumpf thats included in the csv. I delete the TWO rows below the students names

and then highlight from the first students names to the end of the data and copy and “paste values” into cell e2 either paper 1, 2 or 3 of the relevant spreadsheet. I’ve set these tabs up with conditional formatting based on each question too (which is why its currently all red!)

I repeat this process for all three papers and then the only thing I have to check is that the student references are the same for all three papers on the “student reference” tab.
Genuinely its really easy.
The files can be found here (enable macros)
There are loads of other ways to look at the data in more detail on ResultsPlus (if you have any pearls of wisdom that you would like to share I’ll turn the comments on below for you to add your ideas!) but for me I look at the global picture, see if there are lessons to be learned and then move on to the current year 11 for another whirlwind year!
As always, may or may not be useful.

